Command Line Tools#
OpenMDAO has a number of command line tools that are available at your operating system command prompt via the openmdao command.
These can also be accessed using the more pythonic python -m openmdao command.
These two commands are equivalent and will be used interchangably in this documentation.
Note
The openmdao sub-commands, as well as any other console scripts associated with OpenMDAO, will
only be available if you have installed OpenMDAO using pip. See Getting Started
Note
When using a command line tool on a script that takes its own command line arguments, those
arguments must be placed after a -- on the command line. Anything to the right of the
-- will be ignored by the openmdao command line parser and passed on to the user script.
For example: openmdao n2 -o foo.html myscript.py -- -x --myarg=bar would pass
-x and --myarg=bar as args to myscript.py.
All available openmdao sub-commands can be shown using the following command:
python -m openmdao -h
usage: __main__.py [-h] [--version | --dependency_versions | --view_reports]
                    ...

OpenMDAO Command Line Tools

options:
  -h, --help            show this help message and exit
  --version             show program's version number and exit
  --dependency_versions
                        show versions of OpenMDAO and all dependencies, then
                        exit
  --view_reports        after running an OpenMDAO script, display any
                        generated reports

Tools:

    call_tree           Display the call tree for the specified class method
                        and all 'self' class methods it calls.
    check               Perform a number of configuration checks on the
                        problem.
    cite                Print citations referenced by the problem.
    clean               Remove OpenMDAO output directories.
    comm_info           Print MPI communicator info for systems.
    compute_entry_points
                        Compute entry point declarations to add to the
                        setup.py file.
    conn_graph          Generate a graph for a group.
    dist_conns          Display connection information for variables across
                        multiple MPI processes.
    find_repos          Find repos on github having openmdao topics.
    graph               Generate a graph for a group.
    iprof               Profile calls to particular object instances.
    iprof_totals        Generate total timings of calls to particular object
                        instances.
    list_installed      List installed types recognized by OpenMDAO.
    list_pre_post       Show pre and post setup systems.
    list_reports        List available reports.
    mem                 Profile memory used by OpenMDAO related functions.
    mempost             Post-process memory profile output.
    n2                  Display an interactive N2 diagram of the problem.
    partial_coloring    Compute coloring(s) for specified partial jacobians.
    realtime_plot       Run the realtime optimization progress plot tool
    rtplot              Run the realtime optimization progress plot tool once
                        the driver recorder file is started
    scaffold            Generate a simple scaffold for a component.
    scaling             View driver scaling report.
    summary             Print a short top-level summary of the problem.
    timing              Collect timing information for all systems.
    to_compute_primal   Convert a component to use compute_primal instead of
                        compute or apply_nonlinear.
    total_coloring      Compute a coloring for the total jacobian.
    trace               Dump trace output.
    tree                Print the system tree.
    view_cases          View a case recorder file.
    view_coloring       View a colored jacobian.
    view_connections    View connections showing values and source/target
                        units.
    view_dyn_shapes     View the dynamic shape dependency graph.
    view_dyn_units      View the dynamic units dependency graph.
    view_mm             View a metamodel.
    view_reports        View existing reports.

Use -h after any sub-command for sub-command help, for example, "openmdao tree
-h" for help on the "tree" command. If using a tool on a script that takes its
own command line arguments, place those arguments after a "--". For example:
"openmdao n2 -o foo.html myscript.py -- -x --myarg=bar"
To get further info on any sub-command, follow the command with a -h. For example:
python -m openmdao n2 -h
usage: __main__.py n2 [-h] [-o OUTFILE] [--no_values] [--no_browser] [--embed]
                      [--title TITLE] [--path PATH] [--problem PROBLEM_NAME]
                      file

positional arguments:
  file                  Python script or recording containing the model. If
                        metadata from a parallel run was recorded in a
                        separate file, specify both database filenames
                        delimited with a comma.

options:
  -h, --help            show this help message and exit
  -o OUTFILE            html output file.
  --no_values           don't display variable values.
  --no_browser          don't display in a browser.
  --embed               create embeddable version.
  --title TITLE         diagram title.
  --path PATH           initial system path to zoom into.
  --problem PROBLEM_NAME
                        name of sub-problem, if target is a sub-problem
Note
Several of the example commands below make use of the files circuit.py and circle_opt.py. These files are located in the openmdao/test_suite/scripts directory.
Running an OpenMDAO Script#
The openmdao command can be used without any sub-commands to run an OpenMDAO script. Currently, the only advantage to using it this way versus just using the python command is the ability to specify the --view_reports option, which will open a browser window after script execution is complete that lists all the OpenMDAO reports generated during the run for easy viewing.
openmdao --view_reports circle_opt.py
Viewing and Checking Commands#
Usually these commands will exit after executing, rather than continuing to the end of the user’s run script. This makes it convenient to view or check the configuration of a model in any run script without having to wait around for the entire script to run.
openmdao check#
The openmdao check command will perform a number of checks on a model and display
errors, warnings, or informational messages describing what it finds. Some of the available
checks are unconnected_inputs, which lists any input variables that are not connected, and
out_of_order, which displays any systems that are being executed out-of-order.
You can supply individual checks on the command line using -c args. For example:
If you are in Colab or Binder, the shell command will not find the file because it is a single notebook without the included file.
openmdao check -c cycles circuit.py
/home/runner/work/OpenMDAO/OpenMDAO/.pixi/envs/dev/lib/python3.13/site-packages/openmdao/utils/relevance.py:1296: OpenMDAOWarning:The following groups have a nonlinear solver that computes gradients and will be treated as atomic for the purposes of determining which systems are included in the optimization iteration:
circuit

INFO: checking cycles...
INFO: The following groups contain cycles:
INFO:    Group 'circuit' has the following cycles:
INFO:       ['n1', 'n2', 'R1', 'R2', 'D1']
INFO:
INFO:     cycles check complete (0.000224 sec).
Otherwise, a set of default checks will be done. To see lists of the available and default checks, run the following command:
openmdao check -h
usage: openmdao check [-h] [-o OUTFILE] [-p PROBLEM] [-c CHECKS] file

positional arguments:
  file                  Python file containing the model

options:
  -h, --help            show this help message and exit
  -o OUTFILE            output file
  -p, --problem PROBLEM
                        Problem name
  -c CHECKS             Only perform specific check(s). Default checks are:
                        ['comp_has_no_outputs', 'dup_inputs',
                        'missing_recorders', 'out_of_order', 'solvers',
                        'system', 'unserializable_options']. Other available
                        checks are: ['all_unserializable_options', 'cycles',
                        'promotions', 'sparsity', 'unconnected_inputs']
openmdao clean#
OpenMDAO creates an output directory for each problem it runs. This directory contains recording files, optimizer output files, derivative coloring information (if generated), and reports (if generated).
The openmdao clean command recurses through the given path and remove any OpenMDAO output directories found.
OpenMDAO output directories are identified by the presence of an .openmdao_out file, which is automatically added upon their creation.
One note regarding the pattern argument. This pattern provides the glob pattern which the directory names must match to be cleaned.
By default, this is '*_out'. This pattern will be applied regardless of the depth of recursion. On the other hand, providing a glob
pattern to the command such as openmdao clean *_out will only clean directories whose name matches '*_out' in the current working directory.
To prevent expansion of the wildcard pattern, surround the argument of pattern with quotes: --pattern="foo*_out".
usage: openmdao clean [-h] [-f] [-n] [-d] [-p PATTERN] [path ...]

positional arguments:
  path                  Path(s) from which OpenMDAO output directories should
                        be removed.

options:
  -h, --help            show this help message and exit
  -f, --noprompt        Remove output directories without confirmation.
  -n, --norecurse       Do not recurse into subdirectories to find directories
                        to remove.
  -d, --dryrun          Highlight directories to be removed but do not
                        actually remove them.
  -p, --pattern PATTERN
                        Only directories whose name matches this glob pattern
                        will be removed. This glob pattern applies to
                        directory names found when recursing through the given
                        paths. Surround this argument with quotation marks to
                        prevent the OS from interpreting the glob pattern.
openmdao n2#
The openmdao n2 command will generate an \(N^2\) diagram of the model that is
viewable in a browser, for example:
openmdao n2 circuit.py
will generate an \(N^2\) diagram like the one below.
Circuit class definition
class Circuit(om.Group):

    def setup(self):
        self.add_subsystem('n1', Node(n_in=1, n_out=2), promotes_inputs=[('I_in:0', 'I_in')])
        self.add_subsystem('n2', Node())  # leaving defaults

        self.add_subsystem('R1', Resistor(R=100.), promotes_inputs=[('V_out', 'Vg')])
        self.add_subsystem('R2', Resistor(R=10000.))
        self.add_subsystem('D1', Diode(), promotes_inputs=[('V_out', 'Vg')])

        self.connect('n1.V', ['R1.V_in', 'R2.V_in'])
        self.connect('R1.I', 'n1.I_out:0')
        self.connect('R2.I', 'n1.I_out:1')

        self.connect('n2.V', ['R2.V_out', 'D1.V_in'])
        self.connect('R2.I', 'n2.I_in:0')
        self.connect('D1.I', 'n2.I_out:0')

        self.nonlinear_solver = om.NewtonSolver(solve_subsystems=False)
        self.nonlinear_solver.options['iprint'] = 2
        self.nonlinear_solver.options['maxiter'] = 20
        self.linear_solver = om.DirectSolver()
Note
To make use of the --problem argument, it is helpful to give your subproblem a meaningful name when it is instantiated, which you can use to identify it on the command line.
For example:
subprob = om.Problem(name='subproblem1')

subcomp = om.SubmodelComp(problem=subprob)
Then:
openmdao n2 --problem subproblem1
If the test module happens to be part of a python package, then you can also use the dotted module pathname of the test module instead of the filename.
A number of other openmdao commands, includng view_connections and tree, also support this
functionality
openmdao view_connections#
The openmdao view_connections command generates a table of connection information for all input and
output variables in the model. Each row represents a connection between an output and a single input. The viewer’s primary purpose is to help debug a model by making the following things easier:
Identifying unconnected inputs
Highlighting unit conversions or missing units
Identifying missing or unwanted implicit connections
The table can be sorted by any column by clicking on the column header, and a column can be filtered by typing text into the ‘filter column’ field found at the top of each column. Also, any column can be shown or hidden using the toggle buttons at the bottom of the table. When input and output units differ, they are highlighted in red. In the promoted input and output columns, variables that are promoted at some level in the model are shown in blue, while variables that are never promoted are shown in black.
Below is an example of a connection viewer for a pycycle propulsor model obtained using the command:
openmdao view_connections -v propulsor.py
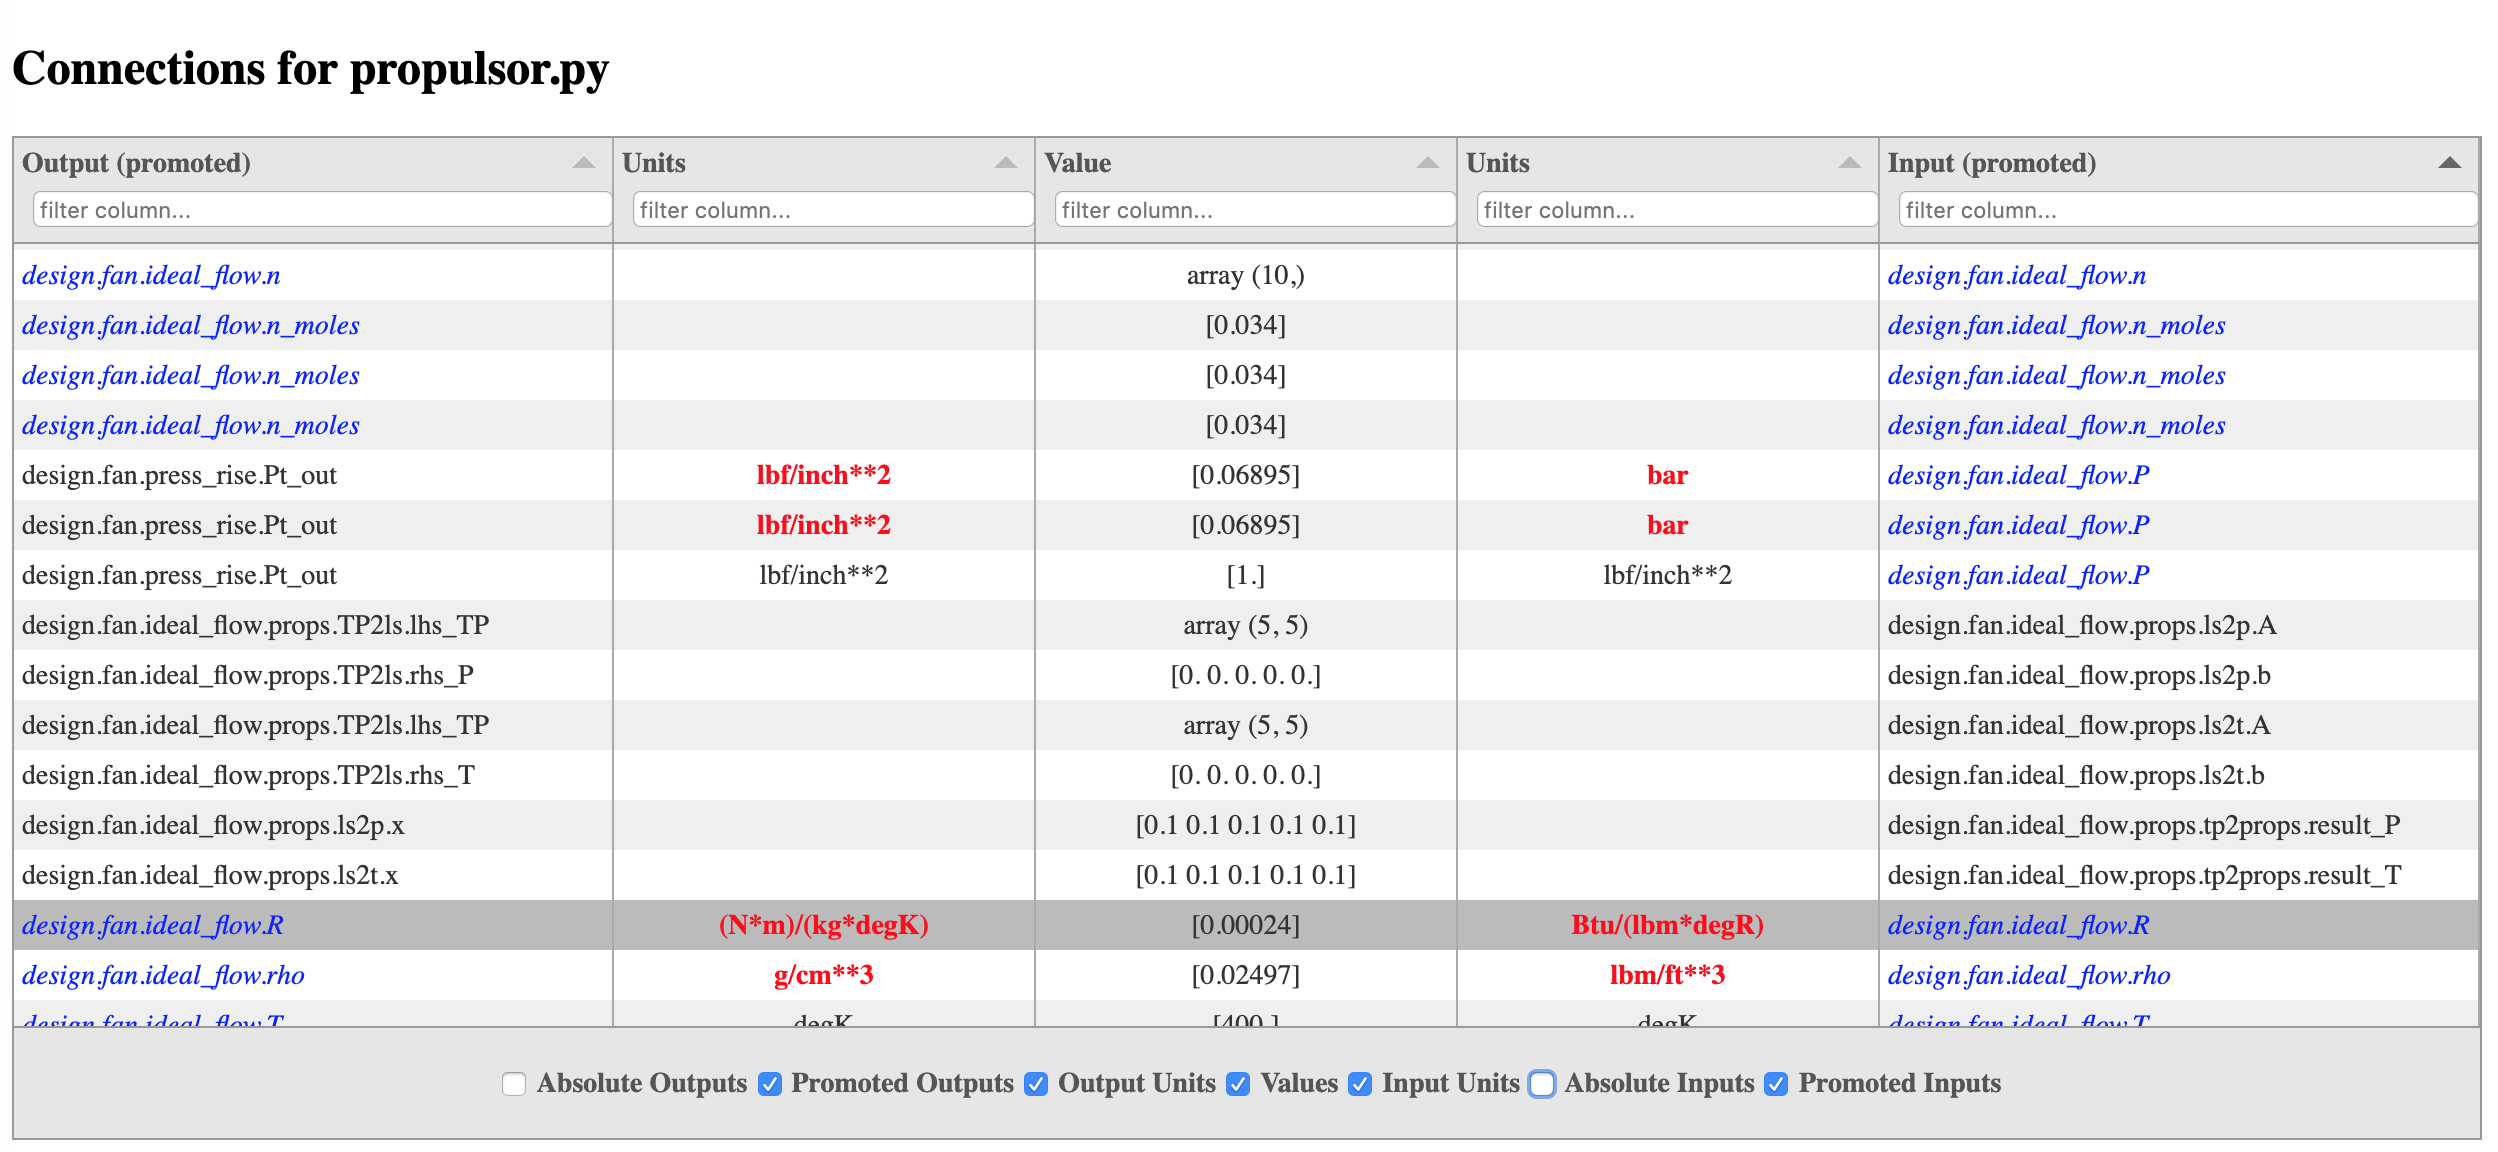
By default the promoted names columns of both inputs and outputs are shown and their absolute names are hidden.
When showing promoted output and promoted input columns, if the promoted output name equals the
promoted input name, that means the connection is an implicit connection. Otherwise the
connection is explicit, meaning somewhere in the model there is an explicit call to connect
that produced the connection.
In OpenMDAO, multiple inputs can be promoted to the same name, and by sorting the promoted inputs column, all such inputs will be grouped together. This can make it much easier to spot either missing or unwanted implicit connections.
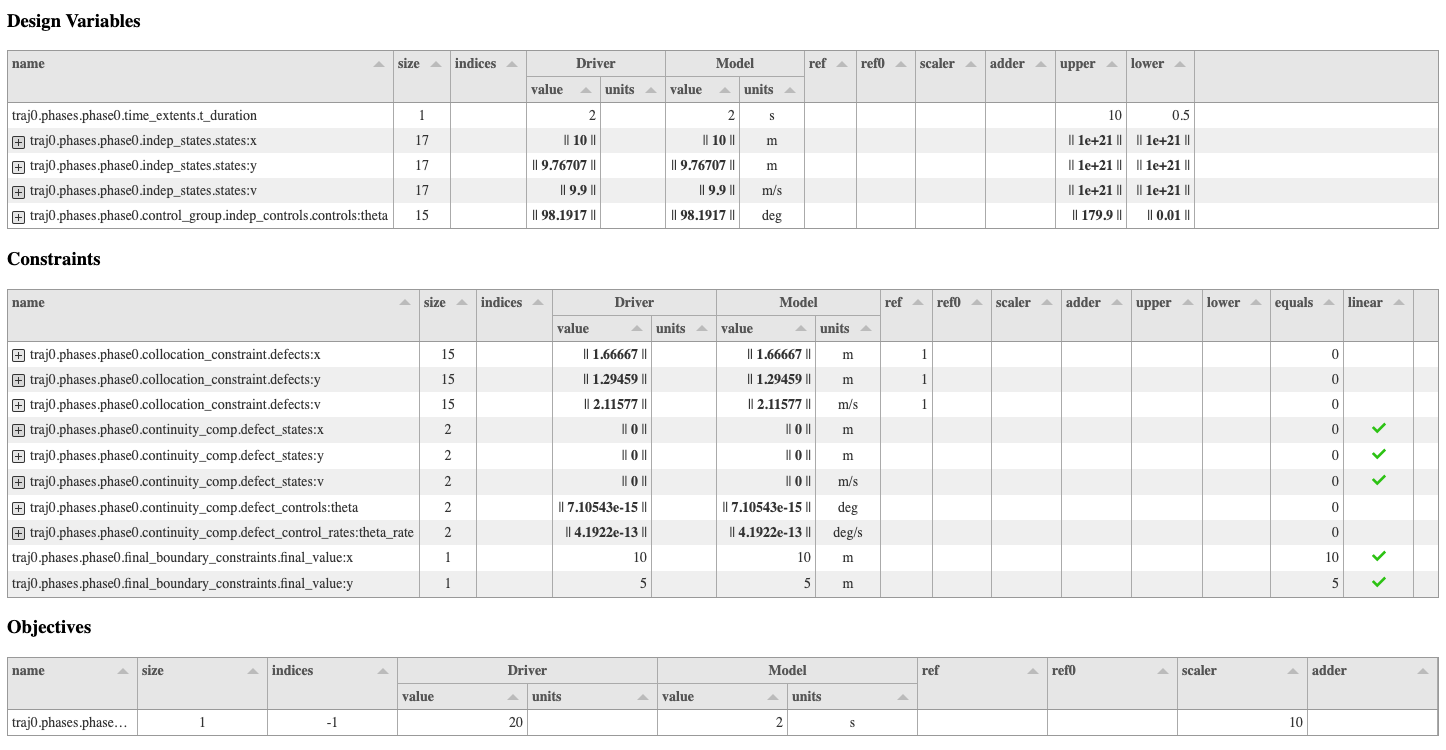
openmdao scaling#
The openmdao scaling command generates tables of information for design variables, objectives,
and constraints, as well as a viewer that shows magnitudes of subjacobians of the total jacobian.
Design variable/objective/constraint tables#
Any of the columns in the design variable, objective, and constraint tables can be sorted by clicking on the header of the desired column. Each row in a table corresponds to an individual design variable, objective, or constraint, and if that variable happens to be an array then the row can be expanded vertically using the “+” button on the far left to show a row for each entry in that array. In the constraints table, if a constraint is linear it will have a green check mark in the “linear” column.
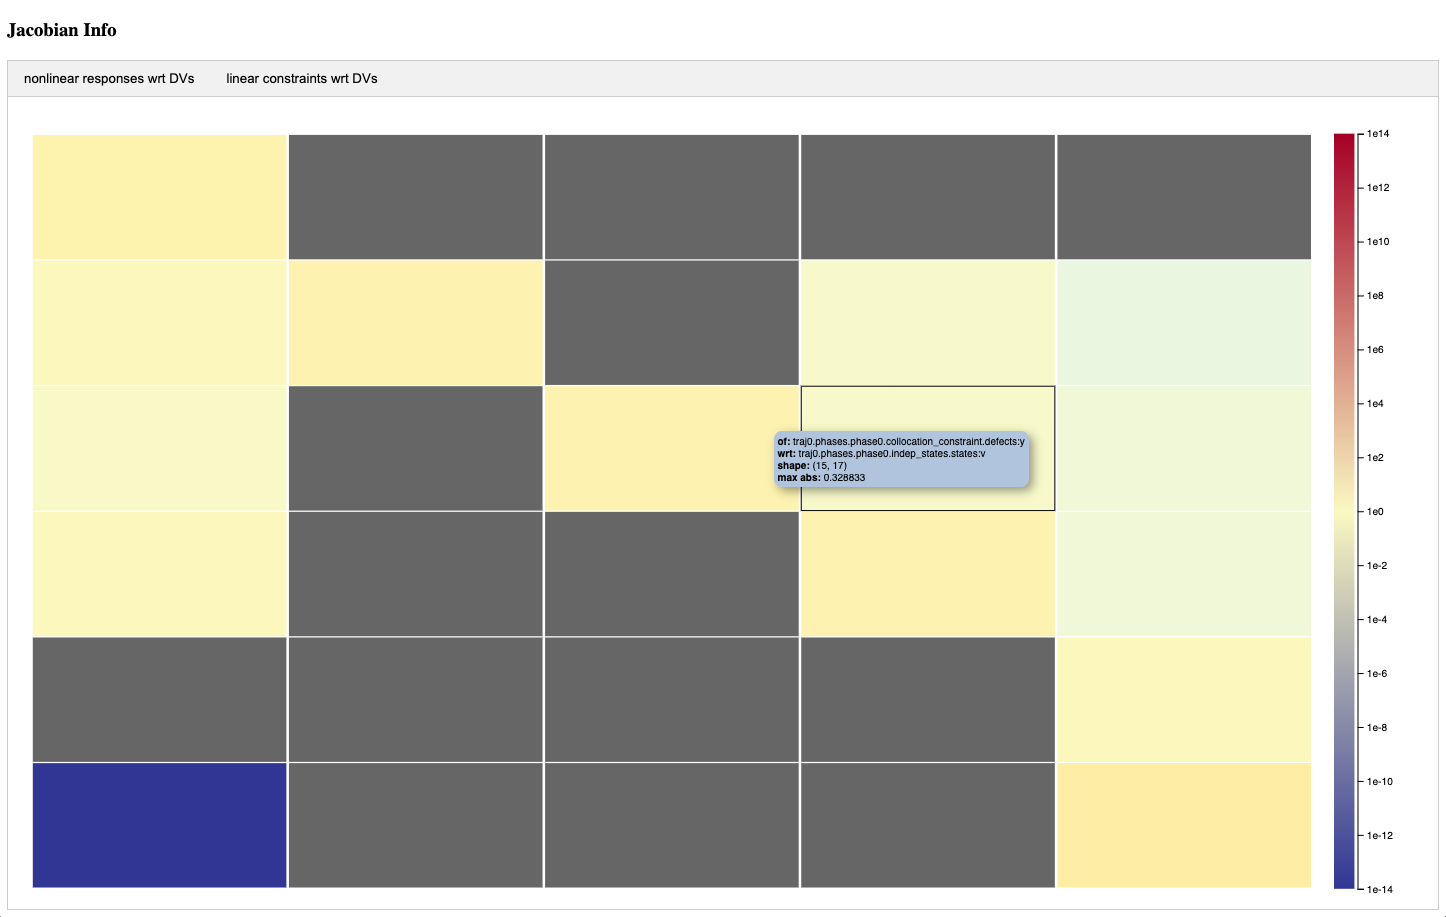
Jacobian viewer#
The jacobian viewer displays magnitude information for each subjacobian of the total jacobian. It contains one column for each design variable and one row for each objective and constraint. If there are linear constraints, the part of the total jacobian that depends on them will be displayed in a separate tab. A detailed view of a given sub-jacobian can be see by left clicking on the corresponding cell in the total jacobian view. It will open a new tab containing the detailed sub-jacobian view. The detailed sub-jacobian view can be closed by right clicking on the tab.
Cells in both the top level and detailed sub-jacobian views will be colored based on the maximum absolute value found in that location. If the location is known to be zero because a total coloring has been computed, it will be dark gray in color. If the location happens to have a value of zero for some other reason, it will be colored light gray. All other values will be displayed using a color map that goes from red at large values down to blue for small values.
Below is an example of what the driver scaling tables and the jacobian view look like:
openmdao tree#
The openmdao tree command prints an indented list of all systems in the model tree. Each system’s
type and name are shown, along with their linear and nonlinear solvers if
they differ from the defaults, which are LinearRunOnce and NonlinearRunOnce respectively.
If the -c option is used, the tree will print in color if the terminal supports it and
the colorama package is installed. If colors are used, implicit and explicit components will be
displayed using different colors.
The input and output sizes can also be displayed using the --sizes arg, and the --approx arg
will display the approximation method and the number of approximated partials for systems that use
approximated derivatives.
The tree command also allows specific attributes and/or vector variables to be printed out along with their
corresponding system in the tree using the --attr and --var args respectively.
Here’s an example of the tree output for a simple circuit model:
openmdao tree --sizes --approx circuit.py
/home/runner/work/OpenMDAO/OpenMDAO/.pixi/envs/dev/lib/python3.13/site-packages/openmdao/utils/relevance.py:1296: OpenMDAOWarning:The following groups have a nonlinear solver that computes gradients and will be treated as atomic for the purposes of determining which systems are included in the optimization iteration:
circuit

Driver: Driver
    Group  (11 / 7)
        IndepVarComp ground (0 / 1)
        IndepVarComp source (0 / 1)
        Circuit circuit (11 / 5)  LN: DirectSolver  NL: NewtonSolver
            Node n1 (3 / 1)  APPROX: ['cs'] (3 of 3)
            Node n2 (2 / 1)  APPROX: ['cs'] (2 of 2)
            Resistor R1 (2 / 1)  APPROX: ['cs'] (2 of 3)
            Resistor R2 (2 / 1)  APPROX: ['cs'] (2 of 3)
            Diode D1 (2 / 1)  APPROX: ['cs'] (2 of 3)
openmdao summary#
The openmdao summary command prints a high level summary of the model. For example:
openmdao summary circle_opt.py
============== Problem Summary ============
Groups:               1
Components:           8
Max tree depth:       1

Design variables:            3   Total size:       21

Nonlinear Constraints:       4   Total size:       21
    equality:                2                     11
    inequality:              2                     10

Linear Constraints:          1   Total size:        1
    equality:                1                      1
    inequality:              0                      0

Objectives:                  1   Total size:        1

Input variables:            11   Total size:       82
Output variables:           10   Total size:       77

Total connections: 11   Total transfer data size: 82

Driver type: ScipyOptimizeDriver
Linear Solvers: [LinearRunOnce]
Nonlinear Solvers: [NonlinearRunOnce]
openmdao cite#
The openmdao cite command prints citations for any classes in the model that have them.
It supports optional -c arguments to allow you to limit displayed citations to
only those belonging to a particular class or group of classes. By default, all citations for
any class used in the problem will be displayed. For example:
openmdao cite circuit.py
/home/runner/work/OpenMDAO/OpenMDAO/.pixi/envs/dev/lib/python3.13/site-packages/openmdao/utils/relevance.py:1296: OpenMDAOWarning:The following groups have a nonlinear solver that computes gradients and will be treated as atomic for the purposes of determining which systems are included in the optimization iteration:
circuit

Class: <class 'openmdao.core.problem.Problem'>
    @article{openmdao_2019,
        Author={Justin S. Gray and John T. Hwang and Joaquim R. R. A.
                Martins and Kenneth T. Moore and Bret A. Naylor},
        Title="{OpenMDAO: An Open-Source Framework for Multidisciplinary
                Design, Analysis, and Optimization}",
        Journal="{Structural and Multidisciplinary Optimization}",
        Year={2019},
        Publisher={Springer},
        pdf={http://openmdao.org/pubs/openmdao_overview_2019.pdf},
        note= {In Press}
        }
Profiling and Tracing Commands#
The following commands perform profiling or tracing on a run script, filtering their target
functions based on pre-defined groups of functions that can be specified using the -g command line option. The available group will be displayed using the -h command line option. For example, here’s the usage output for the openmdao trace command, which includes the function groups available at the time of this writing:
usage: openmdao trace [-h] [-g METHODS] [-v] file

positional arguments:
  file                  Python file to be traced.

optional arguments:
  -h, --help            show this help message and exit
  -g METHODS, --group METHODS
                        Determines which group of methods will be traced.
                        Default is "openmdao". Options are: ['dataflow',
                        'linear', 'mpi', 'openmdao', 'openmdao_all', 'setup']
  -v, --verbose         Show function locals and return values.
openmdao iprof#
The openmdao iprof command will display an icicle plot showing the time elapsed in all of the target
methods corresponding to each object instance that they were called on. For more details, see
Instance-based Profiling.
openmdao iprof_totals#
The openmdao iprof_totals command performs the same profiling as openmdao iprof, but it outputs a simple,
text-based summary of the total time spent in each method. The Instance-based Profiling section contains more details.
openmdao trace#
The openmdao trace command prints a call trace for a specified set of functions. Optionally it can
display values of function locals and return values. For more detail, see Instance-based Call Tracing.
openmdao timing#
The openmdao timing command, like the openmdao iprof command, is meant to show how much time is being spent in methods of particular instances under MPI. The timing command focuses specifically on methods of openmdao components and groups, and it also has features to make it easier to understand how an openmdao model is performing when running under MPI. Aside from the addition of MPI related information, it has the added advantage over openmdao iprof that its overhead is much lower so it shouldn’t increase run time very much, and it shouldn’t distort the timing results as can happen with openmdao iprof. For more details, see
Timing Systems under MPI.
Memory Profiling
openmdao mem#
The openmdao mem command profiles the memory usage of python functions. For more detail,
see Memory Profiling.
openmdao mempost#
The openmdao mempost command postprocesses the raw memory dump file generated by openmdao mem.
For more detail, see Memory Profiling.
Other Commands#
openmdao call_tree#
The openmdao call_tree command takes the full module path of a class method and displays the
call tree for that method. It’s purpose is to show which class ‘owns’ the specified method
call and any other ‘self.*’ methods that it calls. Note that it shows all of the methods called,
regardless of the result of conditionals within any function, so the displayed tree does not
necessarily represent a trace of the function as it executes. The functions are ordered top to
bottom as they are encountered in the source code, and a given subfunction is only displayed
once within a given function, even if it is actually called in multiple places within the function.
Here’s an example:
openmdao call_tree openmdao.api.LinearBlockGS.solve
BlockLinearSolver.solve
  LinearSolver._solve
    Solver._mpi_print_header
    LinearBlockGS._iter_initialize
      BlockLinearSolver._iter_initialize
        BlockLinearSolver._update_rhs_vec
          BlockLinearSolver._create_rhs_vec
        BlockLinearSolver._run_apply
          BlockLinearSolver._union_matvec_scope
        BlockLinearSolver._iter_get_norm
    Solver._mpi_print
    LinearBlockGS._single_iteration
      BlockLinearSolver._union_matvec_scope
    BlockLinearSolver._run_apply
    BlockLinearSolver._iter_get_norm
    Solver._inf_nan_failure
      Solver.report_failure
    Solver._convergence_failure
      Solver.report_failure
openmdao scaffold#
The openmdao scaffold command generates simple scaffolding, or ‘skeleton’ code for
a class that inherits from an allowed OpenMDAO base class. The allowed base classes are shown as
part of the description of the --base arg below:
openmdao scaffold -h
usage: openmdao scaffold [-h] [-c CLASS_NAME] [-b BASE] [-p PACKAGE]
                         [--cmd COMMAND_NAME]

options:
  -h, --help            show this help message and exit
  -c, --class CLASS_NAME
                        Name of the new class. If an output file is not
                        provided, this name will be used to generate the
                        output file name.
  -b, --base BASE       Name of the base class for the new class. Allowed base
                        classes are: ['BaseCaseReader', 'CaseRecorder',
                        'Driver', 'ExplicitComponent', 'Group',
                        'ImplicitComponent', 'LinearSolver',
                        'NonlinearSolver', 'SurrogateModel']
  -p, --package PACKAGE
                        Specify name of python package. If this is specified,
                        the directory structure for a python package will be
                        created.
  --cmd COMMAND_NAME    Create scaffolding for an OpenMDAO command line tool.
In addition, the command will generate the scaffolding for a simple
test file for that class, and if the --package option is used, it will generate the directory
structure for a simple installable python package and will declare an entry point in the
setup.py file so that the given class can be discoverable as an OpenMDAO plugin when installed.
To build scaffolding for an OpenMDAO command line tool plugin, use the --cmd option.
openmdao list_installed#
The openmdao list_installed command lists installed classes of the specified type(s).
Its options are shown below:
openmdao list_installed -h
usage: openmdao list_installed [-h] [-d] [-x EXCLUDES] [-i INCLUDES]
                               [types ...]

positional arguments:
  types                 List these types of installed classes. Allowed types
                        are ['case_reader', 'case_recorder', 'command',
                        'component', 'driver', 'group', 'lin_solver',
                        'nl_solver', 'report', 'surrogate_model'].

options:
  -h, --help            show this help message and exit
  -d, --docs            Display the class docstrings.
  -x, --exclude EXCLUDES
                        Package to exclude.
  -i, --include INCLUDES
                        Package to include.
By default, installed types from all installed packages are shown, but the output can be filtered
by the use of the -i option to include only specified packages, or the -x option
to exclude specified packages.
For example, to show only those linear and nonlinear solver types that are part of the openmdao
package, do the following:
openmdao list_installed lin_solver nl_solver -i openmdao
Installed lin_solvers:

  Package: openmdao  Version: 3.45.0

    Class or Function  Module
    -----------------  ------
    DirectSolver       openmdao.solvers.linear.direct
    LinearBlockGS      openmdao.solvers.linear.linear_block_gs
    LinearBlockJac     openmdao.solvers.linear.linear_block_jac
    LinearRunOnce      openmdao.solvers.linear.linear_runonce
    PETScDirectSolver  openmdao.solvers.linear.petsc_direct_solver
    PETScKrylov        openmdao.solvers.linear.petsc_ksp
    ScipyKrylov        openmdao.solvers.linear.scipy_iter_solver
    LinearUserDefined  openmdao.solvers.linear.user_defined
Installed nl_solvers:

  Package: openmdao  Version: 3.45.0

    Class or Function  Module
    -----------------  ------
    ArmijoGoldsteinLS  openmdao.solvers.linesearch.backtracking
    BoundsEnforceLS    openmdao.solvers.linesearch.backtracking
    BrentSolver        openmdao.solvers.nonlinear.brent
    BroydenSolver      openmdao.solvers.nonlinear.broyden
    NewtonSolver       openmdao.solvers.nonlinear.newton
    NonlinearBlockGS   openmdao.solvers.nonlinear.nonlinear_block_gs
    NonlinearBlockJac  openmdao.solvers.nonlinear.nonlinear_block_jac
    NonlinearRunOnce   openmdao.solvers.nonlinear.nonlinear_runonce
Similarly, to hide all of the built-in (openmdao) solver types and only see installed plugin solver types, do the following.
openmdao list_installed lin_solver nl_solver -x openmdao
openmdao find_repos#
The openmdao find_repos command finds github repositories with openmdao or openmdao plugin specific
strings registered as topics.
Its options are shown below:
openmdao find_repos -h
usage: openmdao find_repos [-h] [--format TABLEFMT] [topics ...]

positional arguments:
  topics             Find github repos with these topics. Allowed topics are
                     ['case_reader', 'case_recorder', 'command', 'component',
                     'driver', 'group', 'lin_solver', 'nl_solver', 'openmdao',
                     'report', 'surrogate_model'].

options:
  -h, --help         show this help message and exit
  --format TABLEFMT  Format for generated table. Defaults to 'tabulator' which
                     generates a sortable, filterable web-based table. Other
                     options include 'html', 'text', 'rst' and 'grid'.
One example of its use would be to display any github repositories claiming to contain openmdao command line tools. At the time this documentation was created, the following repositories were found:
openmdao find_repos command --format text
| ----------------------------------------------------------------------------------------------------------------------------------- |
| Pkg Name      | URL                                     | Topics           | Last Update | Description                              |
| ------------- | --------------------------------------- | ---------------- | ----------- | ---------------------------------------- |
| OpenMDAO-XDSM | https://github.com/onodip/OpenMDAO-XDSM | openmdao-command | 2024-02-10  | XDSM viewer plugin for OpenMDAO          |
| om_devtools   | https://github.com/naylor-b/om_devtools | openmdao-command | 2022-04-28  | Some low level OpenMDAO developer tools. |
| ----------------------------------------------------------------------------------------------------------------------------------- |
openmdao compute_entry_points#
The openmdao compute_entry_points command lists entry point groups and entry points for
any openmdao compatible classes, e.g., Component, Group, etc., that it finds within a given
python package. Its options are shown below:
openmdao compute_entry_points -h
usage: openmdao compute_entry_points [-h] [-o OUTFILE] package

positional arguments:
  package     Compute entry points for this package.

options:
  -h, --help  show this help message and exit
  -o OUTFILE  output file.
For example, to show all of the potential openmdao entry point groups and entry points for an
installed python package called mypackage, you would do the following:
openmdao compute_entry_points mypackage
The entry point information will be printed in a form that can easily be pasted into the
setup.py file for the specified package.
Using Commands under MPI#
In general, usage of openmdao subcommands under MPI is the same as usual, except the command will
be preceded by mpirun -n <num_procs>. For example:
mpirun -n 2 openmdao summary multipoint_beam_opt.py
============== Problem Summary ============
Groups:               4
Components:          10
Traceback (most recent call last):
Traceback (most recent call last):
  File "/home/runner/work/OpenMDAO/OpenMDAO/.pixi/envs/dev/bin/openmdao", line 6, in <module>
    sys.exit(openmdao_cmd())
             ~~~~~~~~~~~~^^
  File "/home/runner/work/OpenMDAO/OpenMDAO/.pixi/envs/dev/lib/python3.13/site-packages/openmdao/utils/om.py", line 852, in openmdao_cmd
    options.executor(options, user_args)
    ~~~~~~~~~~~~~~~~^^^^^^^^^^^^^^^^^^^^
  File "/home/runner/work/OpenMDAO/OpenMDAO/.pixi/envs/dev/lib/python3.13/site-packages/openmdao/utils/om.py", line 252, in _config_summary_cmd
    _load_and_exec(options.file[0], user_args)
    ~~~~~~~~~~~~~~^^^^^^^^^^^^^^^^^^^^^^^^^^^^
  File "/home/runner/work/OpenMDAO/OpenMDAO/.pixi/envs/dev/lib/python3.13/site-packages/openmdao/utils/file_utils.py", line 208, in _load_and_exec
    exec(code, globals_dict)  # nosec: private, internal use only
    ~~~~^^^^^^^^^^^^^^^^^^^^
  File "multipoint_beam_opt.py", line 36, in <module>
    prob.run_driver()
    ~~~~~~~~~~~~~~~^^
  File "/home/runner/work/OpenMDAO/OpenMDAO/.pixi/envs/dev/lib/python3.13/site-packages/openmdao/core/problem.py", line 702, in run_driver
    self.final_setup()
    ~~~~~~~~~~~~~~~~^^
  File "/home/runner/work/OpenMDAO/OpenMDAO/.pixi/envs/dev/lib/python3.13/site-packages/openmdao/utils/hooks.py", line 370, in __call__
    self._run_hooks(self.post_hooks, args, kwargs, ret)
    ~~~~~~~~~~~~~~~^^^^^^^^^^^^^^^^^^^^^^^^^^^^^^^^^^^^
  File "/home/runner/work/OpenMDAO/OpenMDAO/.pixi/envs/dev/lib/python3.13/site-packages/openmdao/utils/hooks.py", line 350, in _run_hooks
    hook(inst, args, kwargs, ret)
    ~~~~^^^^^^^^^^^^^^^^^^^^^^^^^
  File "/home/runner/work/OpenMDAO/OpenMDAO/.pixi/envs/dev/lib/python3.13/site-packages/openmdao/utils/hooks.py", line 162, in __call__
    ret = self._call_hook(inst, args, kwargs, ret)
  File "/home/runner/work/OpenMDAO/OpenMDAO/.pixi/envs/dev/lib/python3.13/site-packages/openmdao/utils/hooks.py", line 194, in _call_hook
    return self.hook(inst, **self.reg_kwargs)
           ~~~~~~~~~^^^^^^^^^^^^^^^^^^^^^^^^^
  File "/home/runner/work/OpenMDAO/OpenMDAO/.pixi/envs/dev/lib/python3.13/site-packages/openmdao/devtools/debug.py", line 270, in config_summary
    printer("Max tree depth:   %5d" % global_max_depth)
            ~~~~~~~~~~~~~~~~~~~~~~~~^~~~~~~~~~~~~~~~~~
TypeError: %d format: a real number is required, not numpy.ndarray
--------------------------------------------------------------------------
prterun detected that one or more processes exited with non-zero status,
thus causing the job to be terminated. The first process to do so was:

   Process name: [prterun-runnervm3jd5f-11803@1,1]
   Exit code:    1
--------------------------------------------------------------------------
============== Problem Summary ============
Groups:               4
Components:          10
Max tree depth:       3

Design variables:            1   Total size:        5

Nonlinear Constraints:       1   Total size:        1
    equality:                1                      1
    inequality:              0                      0

Linear Constraints:          0   Total size:        0
    equality:                0                      0
    inequality:              0                      0

Objectives:                  1   Total size:        1

Input variables:            10   Total size:     1961
Output variables:           10   Total size:     1117

Total connections: 10   Total transfer data size: 1961

Driver type: ScipyOptimizeDriver
Linear Solvers: [LinearRunOnce x 4]
Nonlinear Solvers: [NonlinearRunOnce x 4]