Using the Real-time Optimization and Analysis Progress Plots#
The real-time optimization and analysis progress plots feature allows the user to see, in real-time, the progress of an optimization or analysis run.
There are two different plots for optimization and analysis. These will be explained below.
Using the rtplot command#
Plotting is done using the opendmao rtplot subcommand. The command can be used for both optimization and analysis runs. The command detects what type of Driver is being used and generates the appropriate plot. The plotting is done using a browser-based application.
In addition to plotting in real-time, as a script runs, the command can be used for plotting after a run by having the command read a case recorder file. These examples will explain the 4 different situations:
Real-time plotting of optimization run#
openmdao rtplot path_to_optimization_script.py
This will run the optimization script and also automatically launch the plotting app in a browser window at the appropriate time during the optimization run.
The plot will then be periodically be updated as the results of driver iterations complete.
Real-time plotting of analysis run#
Similar to the optimiztion example, if the script is an analysis run, use a command of this form.
openmdao rtplot path_to_analysis_script.py
Post run plotting of optimization run#
If an optimization run has been completed and the user would like to see a post-run plot, use a command like this.
openmdao rtplot name_of_optimization_script_out/cases.sql
Post run plotting of analysis run#
Similary, if an analysis run is complete, use this form of the command.
openmdao rtplot name_of_analysis_script_out/cases.sql
Important
Plotting of the driver iterations will only work if the script has a case recorder attached to the Driver.
Real-time Optimization Progress Plot User Interface#
The plot is very easy to use. Here is an example of what it can look like
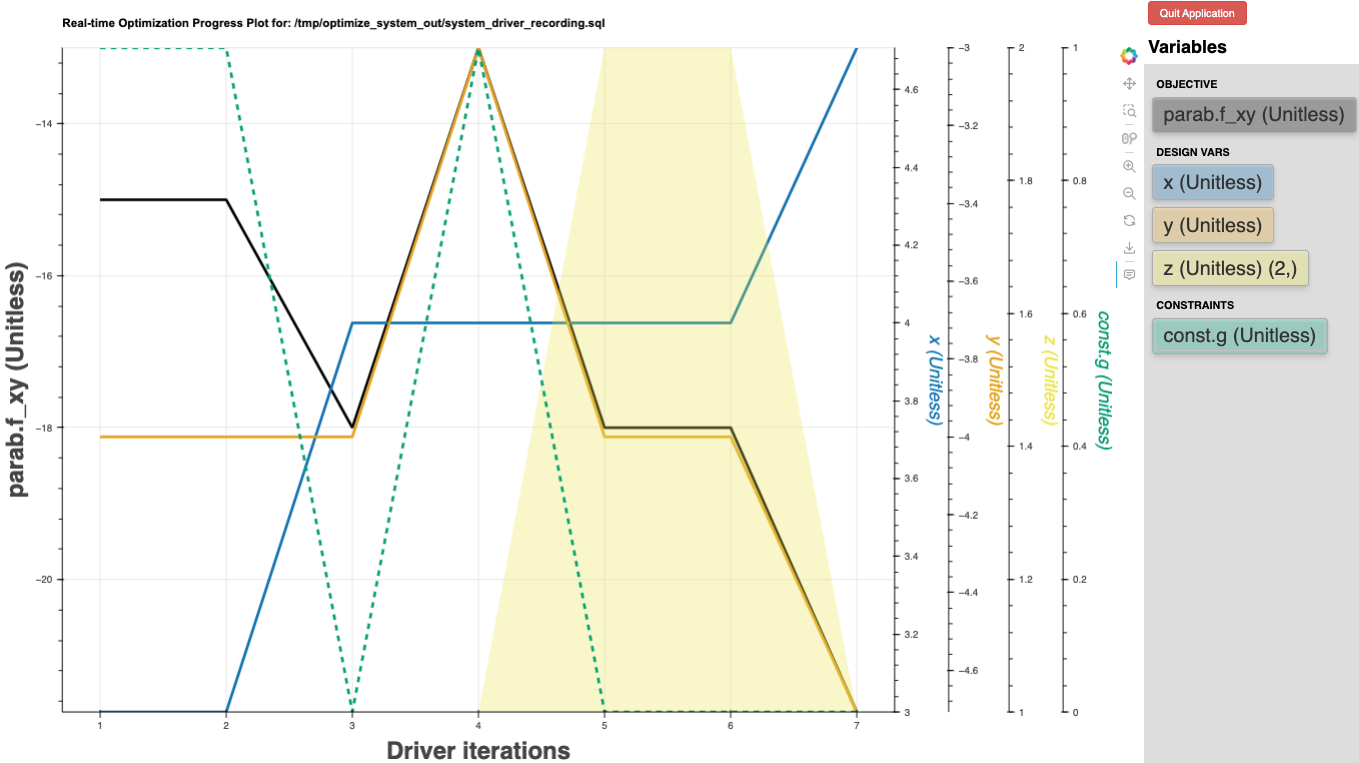
Initially, only the objective is plotted. Additional variables can be plotted by clicking on the button containing their name in the list on the right. In the example above all of them have already been selected and plotted.
The objective axis is always on the left. Additional axes are created on the right as the user selects other variables to plot. The colors of the line, button, and axis label match.
The variables buttons also include information about the units and, if the variable is a vector, the shape of the vector.
For a design variable that is a vector, like z in the plot, the plot shows the range of all the values in the vector, with a solid fill between the min and the max values.
For constraints, if they are vectors, the plot shows the worst case constraint among the values of the vector, using the infinity norm function, which returns the maximum absolute value among all elements in the vector.
The optimization plot is created by running a small, local server using the Bokeh plotting library. To stop the server, the user can click on the Quit Application button in the upper right of the plot page.
Real-time Analysis Progress Plot User Interface#
Here is an example of an analysis plot.
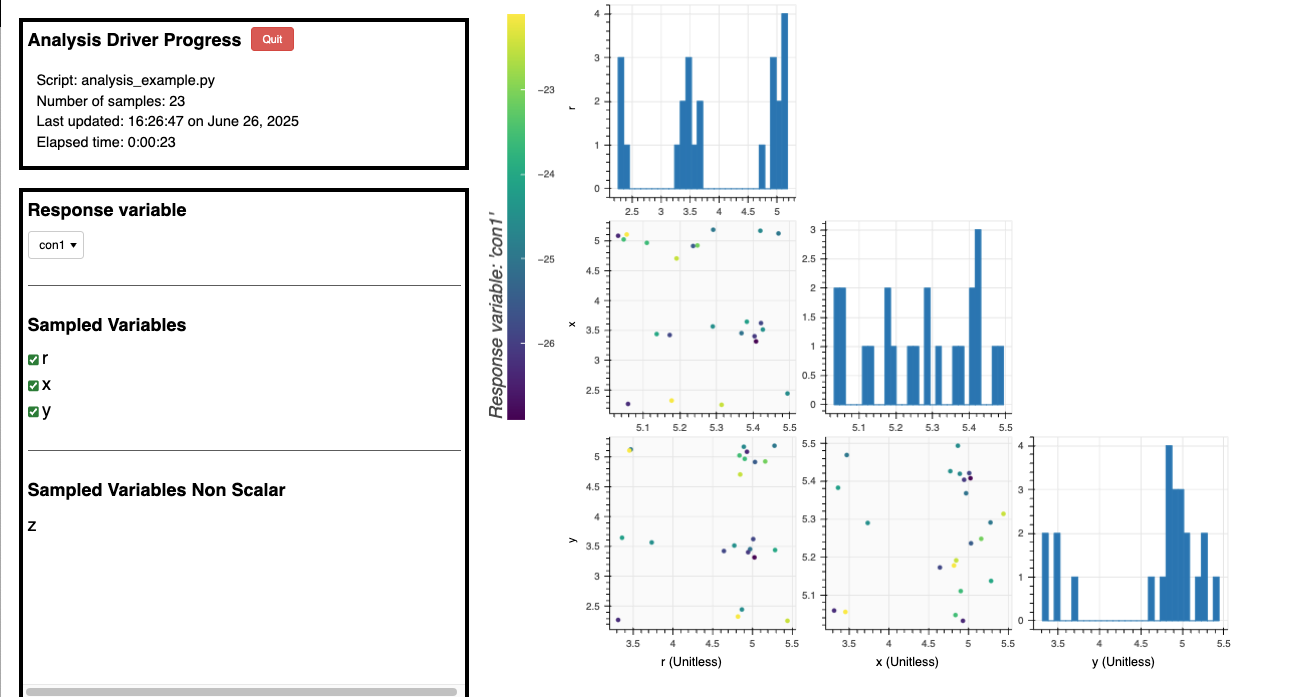
On the diagonal of the visualization on the right, histograms show the sampled variable distributions.
Below the diagonal, are scatter plots with pairs of variables along the x and y axes of the plots. The dots in the plot represent one run of the analysis. The x and y location are determined by the sampled variable pairs. The color of the dot represents the value of the response variable.
The user can modify what response variable is being visualized using the menu on the left.
They can also modify which sampled variables are shown using the checkboxes on the left. Initially only up to four are plotted because of space limitations. But more can be added as desired by the user.
There is also a section on the left showing non-scalar samples variables. In this version of OpenMDAO, these cannot be plotted in this visualization but are shown for completeness.
The visualization also includes some basic run information in the box in the upper left.
In the upper left, is a box with basic information about the run.
Below that, is where the user can select what is being plotted. The